Case Control Study
All India Institute of Medical Sciences, Bhopal
Comparisons
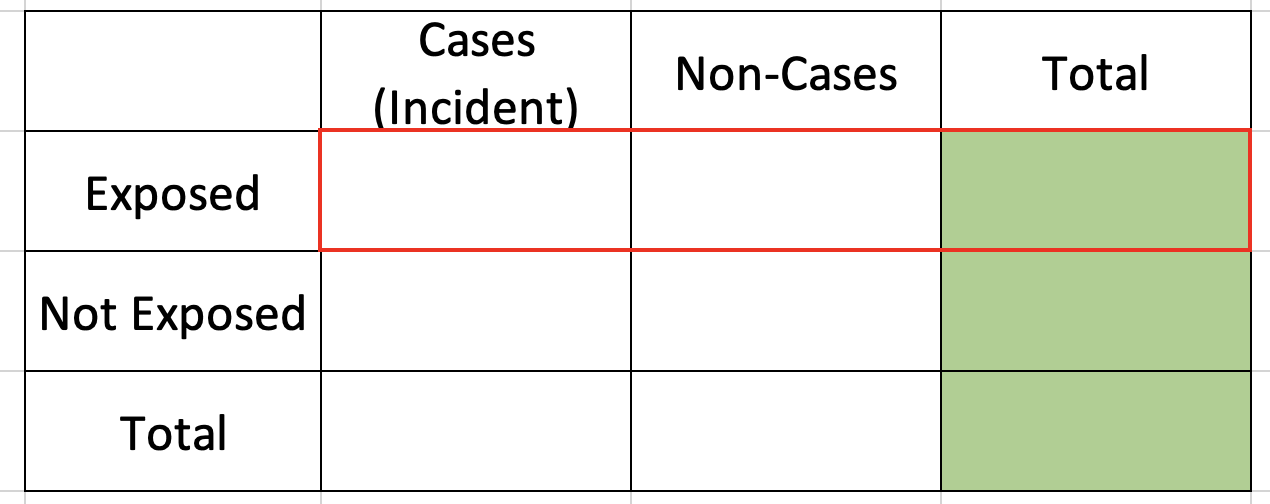
Cohort Study
We know totals of exposed and non-exposed since we only fix them
We estimate incidence in exposed & non-exposed and compare relative incidence
![]()
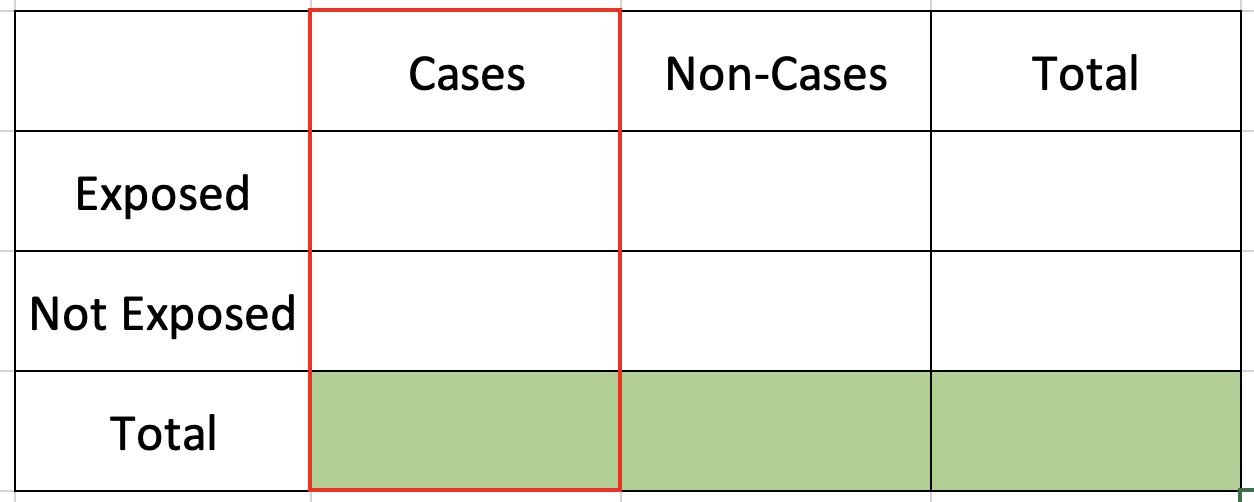
Case-Control Study
We know totals of Cases and Non-cases since we only fix them
We estimate exposure odds among cases & non-cases & compute ratio of two odds
![]()
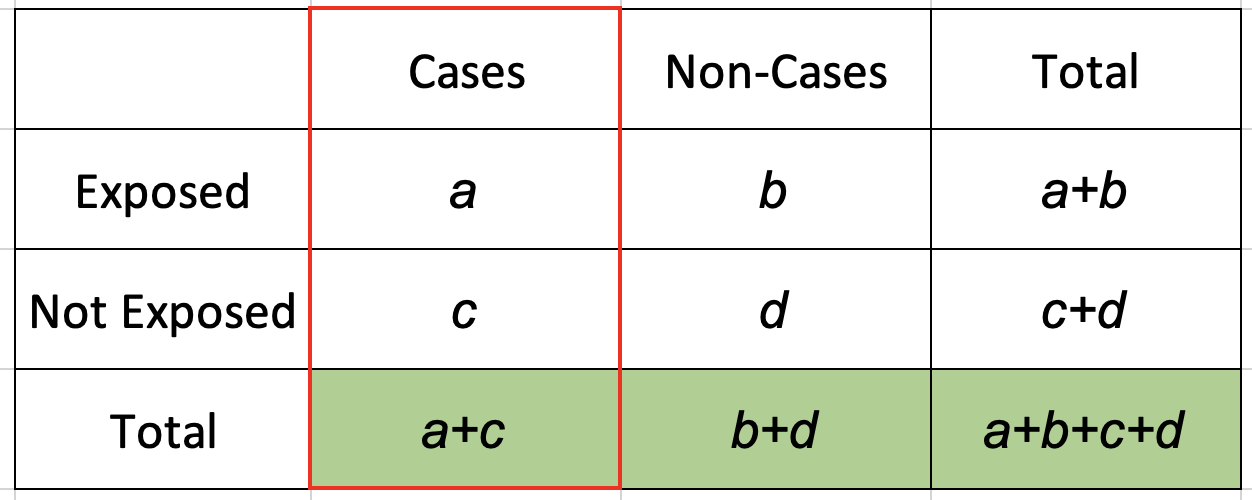
Odds ratio
\(Odds\ of\ exposure\ in\ Cases = \frac{Number\ of\ exposed\ among\ Cases}{Number\ of\ non-exposed\ among\ Cases}\)
\(Odds\ of\ exposure\ in\ Cases = \frac{a}{c}\)
\(Odds\ of\ exposure\ in\ Non-Cases = \frac{Number\ of\ exposed\ among\ Non-Cases}{Number\ of\ non-exposed\ among\ Non-Cases}\)
\(Odds\ of\ exposure\ in\ Non-Cases = \frac{b}{c}\)
\(Odds\ ratio = \frac{Odds\ of\ exposure\ among\ Cases}{Odds\ of\ exposure\ among\ Non-Cases}\)
\(Odds\ ratio = \frac{ad}{bc}\)
References
Celentano, David D., and Moyses Szklo. 2018. Gordis Epidemiology. Elsevier Health Sciences.
Fletcher, Robert, Suzanne W. Fletcher, and Suzanne W. Fletcher, MD Msc. 2013. Clinical Epidemiology: The Essentials. Lippincott Williams & Wilkins.
Schilcher, Jörg, Karl Michaëlsson, and Per Aspenberg. 2011. “Bisphosphonate Use and Atypical Fractures of the Femoral Shaft.” New England Journal of Medicine 364 (18): 1728–37. https://doi.org/10.1056/NEJMoa1010650.